

Sneak peek behind the scenes - our application
- Hélène Smidt

- Feb 26
- 1 min read
Updated: Mar 4
Written by Hélène Smidt
In the last two months, we’ve received membership requests from ship owners, ship managers, and weather-routing companies who want to collaborate and integrate whale data into voyage planning on more than 10,000 vessels.
At the same time, additional whale data is coming in from all over the world, helping us map whale-sensitive zones more accurately than ever. That means our two application heroes -Erik Roscam Abbing and Werner huysmans - have been working hard plotting it all into our system. All our (gathered) recommendations are now available in API version or any other preferred format.
So how does it work?
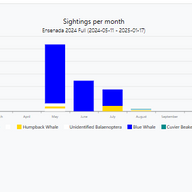
Step 1: (Recent) whale data is plotted on a chart
Step 2: Vessel traffic from the last year are plotted in that same area
Step 3: Areas to be avoided/slow down zones are being determined based on the seasonality of when the whales are actually present
Step 4: Members receive quarterly reports on how their vessels are performing


Our mission is to become the global platform where whale data is aggregated into realistic routing recommendations, making it easy for the shipping industry to integrate whale protection directly into voyage planning.
In October 2025, the team was awarded a Blue Innovation award by de Blauwe Cluster which has resulted in this nice video below:
(In)Direct whale Data Partners
Our efforts to protect these magnificent creatures wouldn't be possible without the help of our (in)direct data partners:


Comments